The NFL is the biggest single sports league on Polymarket by volume: about $409 million traded in the 30 days to October 10, 2026. More than 5,000 wallets made at least 10 NFL trades in the 15 days before September 28. We tested Polymarket copy trading on leagues like this one: rank the wallets whose copied bets did best over the previous two months, copy their first buy in each market over the next month, and measure what a copier would have made. In the NFL that came to between -$1.63 and +$1.46 per $10, with no month clearly different from zero.
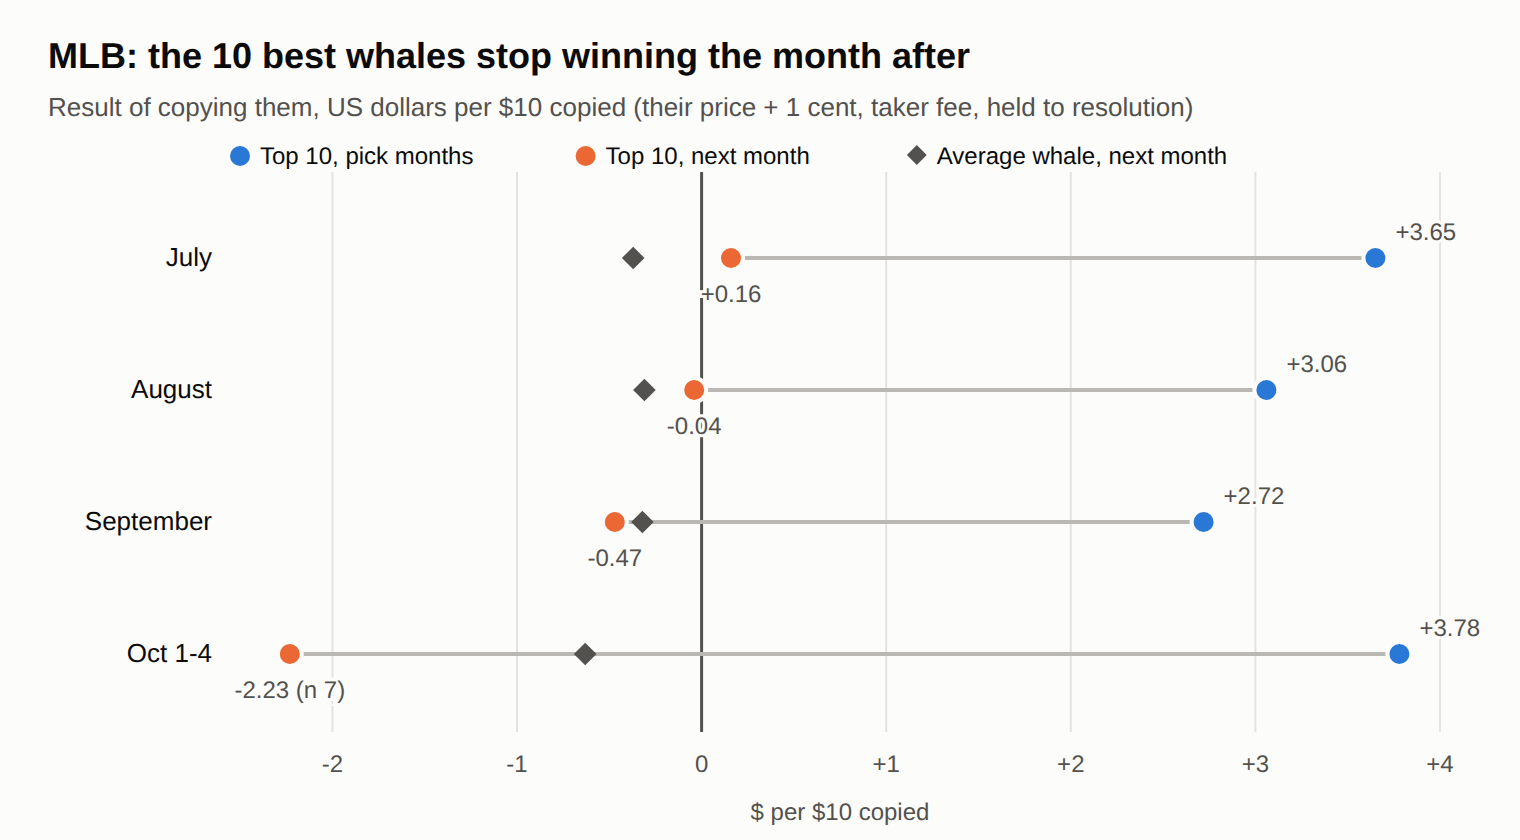
The same thing happened in MLB, college football and League of Legends, with two different ways of picking whales. In MLB, the 10 best copy targets of the previous two months averaged +$2.72 to +$3.78 per $10 copied. The month after, the same rule returned between -$2.23 and +$0.16. The average whale, copied one cent worse than its own price, lost money in every MLB test month and in most NFL and college football months.
The data and the monthly tables are public in the Polymarket copy trading backtest on GitHub.
Polymarket copy trading results in 5 sports
| Sport | What we tested | Result after the pick |
|---|---|---|
| MLB | 799,542 copied buys, May to early October 2026 | Top 10 drop from about +$3 to about $0 per $10; rank correlation month to month close to 0 |
| NFL | 196,351 copied buys, 2025-26 season and September to early October 2026 | Picked wallets between -$1.63 and +$1.46 per $10, no month with a t-statistic of 2; average whale mostly negative |
| College football | 123,561 copied buys | Mostly negative; the top 10 for November lost $1.07 per $10 (t -2.8) |
| League of Legends | Pools of 54 to 89 wallets, 6 pick dates | All 12 results negative (2 copy rules per pick date) |
| Valorant | Pools of 2 to 10 wallets | Too small to test properly; two wallets almost never agree |
MLB has the most trades of the five, so it comes first.
Polymarket MLB: 800,000 copied buys, last month's winners go flat
Baseball gave us the cleanest test: 3.6 million trades of $20 or more, 27,564 wallets and 799,542 copied buys between May and early October 2026.
Each month we picked whales from the two months before and copied them only in the month after. Three rules, fixed before the run: every wallet with at least 10 copies (the average whale), every wallet with a clearly positive copy result (at least 20 copies, mean above zero, t of 2 or more), and the 10 best by t-statistic.
| Test month | Top 10 while being picked | Top 10 the month after | Average whale the month after |
|---|---|---|---|
| July | +$3.65 per $10 | +$0.16 (t +0.8) | -$0.37 (t -5.9) |
| August | +$3.06 | -$0.04 (t -0.3) | -$0.31 (t -5.7) |
| September | +$2.72 | -$0.47 (t -0.5) | -$0.32 (t -5.5) |
| October (to Oct 4) | +$3.78 | -$2.23 (t -0.5, n 7) | -$0.63 (t -2.4) |
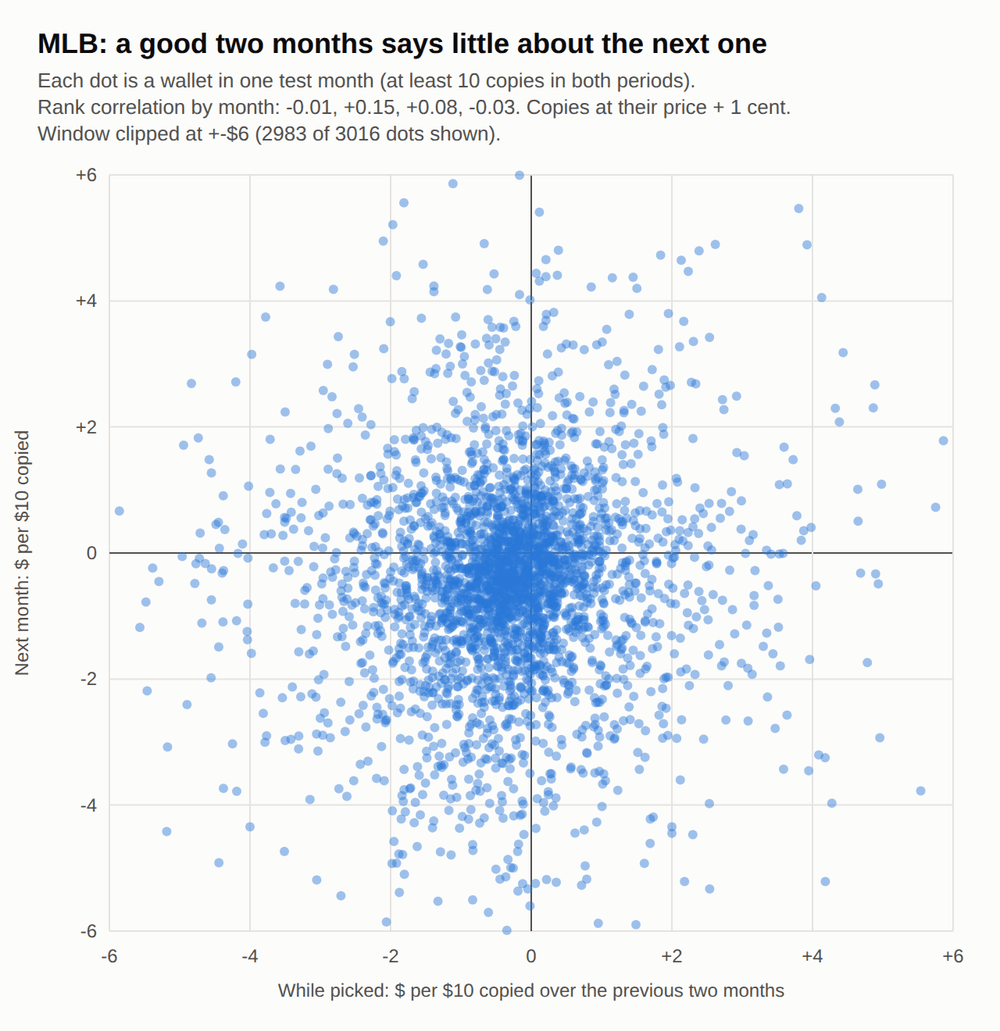
We also checked whether a wallet's rank carries over. For wallets with at least 10 copies in both periods, the Spearman correlation between the pick months and the next month was -0.01, +0.15, +0.08 and -0.03. A wallet near the top in May and June was about as likely to be near the bottom in July. At three cents above the whale's price instead of one, every row in the table is negative, including the top 10.
Copying Polymarket NFL and college football whales: few specialists, no edge
Few football wallets on Polymarket pass a strict profile screen. Ours (at least $400 profit, a profit factor of at least 1.25, ROI of at least 4%, and at least 35% of the activity in that sport, plus the checks listed in the methodology) let through 7 to 17 NFL wallets on each pick date and 0 to 2 in college football.
Picking by copy result gives lists of a similar size in the NFL and longer ones in college football. The results were not better:
| Test month | NFL picked wallets, two rules | NFL average whale | College football average whale |
|---|---|---|---|
| Nov 2025 | -$1.25 / +$0.42 | -$0.20 | -$0.44 (t -2.1) |
| Dec 2025 | -$0.26 / -$0.18 | -$0.07 | -$0.28 |
| Jan 2026 | -$1.63 / -$1.54 | -$0.19 | -$0.36 |
| Sep 2026 | +$1.46 / +$0.87 | -$0.25 | -$0.64 (t -4.0) |
| Oct 2026 (to Oct 6) | +$0.54 / +$0.54 | -$0.53 (t -2.7) | -$0.30 |
The NFL column shows the clearly positive wallets first and the top 10 second. Across five test months, neither rule reached a t-statistic of 2 in either direction. In college football, the November top 10 lost $1.07 per $10 over 624 copies (t -2.8). Wallet by wallet, the rank correlation between the pick months and the next month was between -0.09 and +0.03 in the NFL and between -0.19 and +0.13 in college football, as close to zero as in MLB. We did not find an NFL wallet worth copying on past results with these rules.
Polymarket esports copy trading: LoL and Valorant pools
For esports we used the same profile screen. In League of Legends it produced pools of 54 to 89 wallets out of roughly 6,000 to 9,200 candidates. We copied each pool over the following days in two ways: the first pool buy of each outcome (K1), and only when a second pool wallet bought the same outcome (K2).
| Pick date | Pool | K1 after the pick | K2 after the pick |
|---|---|---|---|
| Jun 15 | 71 | -$0.24 | -$0.31 |
| Jul 10 | 73 | -$0.08 | -$0.56 |
| Jul 31 | 89 | -$0.08 | -$0.09 |
| Aug 20 | 59 | -$0.14 | -$0.27 |
| Sep 10 (24 days) | 54 | -$0.21 | -$0.07 |
| Sep 20 (14 days) | 68 | -$0.75 | -$1.02 |
All 12 results are negative, though none is significant on its own (t between -0.1 and -1.5). The test windows are 30 days, except the last two, where our data ended on October 4.
Valorant is a much smaller market, about $37 million in 30 days against $271 million for LoL. The same screen found only 2 to 10 wallets, and two of them agreeing on a bet almost never happened. K1 had only 22 to 72 copies per pick date, too few to say anything either way.
Why copying the best Polymarket whales stops working
Most of it is luck in the selection. With thousands of active wallets, dozens will have a great two months by chance, and sorting by past results puts exactly those wallets at the top. The MLB rank correlations of -0.03 to +0.15 between one period and the next fit that.
The baseline is also below zero. Copied one cent worse than its own price, the average wallet lost 31 to 63 cents per $10 in every MLB test month, and it was negative in most NFL and college football months too. So a rule that does only as well as the average wallet still loses money.
And one cent is a generous assumption. In fast in-play markets the price can move a lot further before a copy fills. In our first issue, wallets that made +$2.33 per $10 at their own prices came out at -$0.10 when copied 1 to 5 seconds later.
Methodology
- Data: on-chain Polymarket trades from our own indexer, markets matched by slug prefix (mlb, nfl, cfb, lol, val). Copies: MLB, LoL and Valorant from May 1 to October 4, 2026; NFL and college football from August 2025 to early October 2026. The profile screen's track records use each wallet's full earlier history in that sport.
- What a copy is: a wallet's first buy of at least $20 in a market, at a price between 0.30 and 0.85. We buy the same outcome for $10 at their price plus 1 cent (plus 3 cents as a stress test in MLB), pay the sports taker fee of 0.05 x p x (1 - p), and hold to resolution.
- Walk-forward by copy result (MLB, NFL, college football): wallets are picked on the two months before the test month. For the September 2026 NFL and college football test, the pick used November 2025 to January 2026, the previous season. Nothing from the test month is used. In MLB the "average whale" is every copy of every wallet with at least 10 copies; in NFL and college football each result counts only the first buy by any picked wallet on each outcome.
- Profile screen (LoL, Valorant, and the NFL and college football pool counts): wallets with at least 10 fills on that sport's matches in the 15 days before the pick date and a track record from earlier markets that passes the thresholds above, covers at least 30 positions and 15 matches, has profit in both halves of the record, has no single position worth half of the profit, and has at most 8 fills per position, at most 20% hedged positions and at most 25% of entries at 0.90 or higher. We drop wallets that opened more than 70 new positions in the 7 days before the pick date, and when two wallets bought the same outcomes a median of 60 seconds or less apart on 10 or more markets, we drop the less profitable one. One check looks ahead: the 35% sport share uses each wallet's full history up to October 7, 2026. That most likely flatters the pools, because it favors wallets that kept betting the sport afterward, and they still showed no edge.
- Statistics: mean result per $10 copied and its t-statistic. In MLB the t-statistic uses standard errors clustered by market, so copies in the same market are treated as correlated. For NFL, college football, LoL and Valorant it is the plain t-statistic, so treat values near 2 there with extra caution.
The full monthly tables, including the rules not shown above, are in the repository. It also has a script that reruns the test on the OrcaLayer API for any league. On a sample of 800 MLB games it produced the same 161,094 copies as our database did for those games, with every price and result equal, and the same picture: the top 10 went from about +$3 per $10 to between -$1.29 and +$1.06 the month after, none of them significant.
FAQ
Does Polymarket copy trading work? Not when you pick whales by their past results in MLB, NFL, college football, LoL or Valorant. In MLB the 10 best wallets of the previous two months made +$2.72 to +$3.78 per $10 copied, then -$2.23 to +$0.16 the month after.
Do the best Polymarket whales keep winning? In the five sports we tested, no. In MLB the rank correlation between a wallet's result in the pick months and its result the next month was between -0.03 and +0.15, close to zero.
Is copying the average Polymarket whale profitable? No. Copied one cent worse than its own price, the average wallet lost 31 to 63 cents per $10 in every MLB test month and lost money in most NFL and college football months.
How should you test a Polymarket copy trading strategy? Walk-forward: pick wallets on one period, measure them on the next one at a price you could really get, and compare with the average wallet after fees.
What we did not test
This covers five sports on Polymarket (MLB, NFL, college football, LoL and Valorant) and picking wallets by their past results. It does not cover slower markets such as politics or long-dated events, where informed money can stay ahead for days, and it does not cover picking wallets by how they trade rather than how much they made. Our methodology page and why a 99% win rate is a trap explain how the leaderboard separates track record from luck.
Takeaways
- Do not pick copy targets from a one- or two-month leaderboard. In these five sports that ranking did not survive the next month.
- Run any copy rule walk-forward, with a copy price at least one cent worse than the whale's.
- Check the average wallet first. If it loses after fees, a "best wallets" rule starts from a negative baseline.
- If a pool looks great on past data, run it forward on new data before you put money on it.
This is the second issue of our negative-results series. The first, Polymarket strategies that don't work, covers arbitrage, market making and copying wallets that buy before goals.
This is research, not financial advice. Results reflect our data and period (August 2025 to October 2026).